Building a Guardrailed AI Operations Agent for Kubernetes
Building a Kubernetes operations agent that uses LLM reasoning, policy gates, and deterministic telemetry checks to detect failures and prove real recovery.

I recently built a Kubernetes operations agent that combines LLM reasoning with Prometheus telemetry, Kubernetes APIs, approval controls, and deterministic recovery checks.
The goal was not to give an LLM unrestricted kubectl access. The goal was to test whether an agent could detect an application failure, correlate telemetry with cluster state, propose a bounded remediation, respect approval policy, execute it, and prove the application recovered.
This post walks through that lab: what failed, how the agent diagnosed it, why the first recovery logic was not good enough, and what made the final version trustworthy.
Architecture
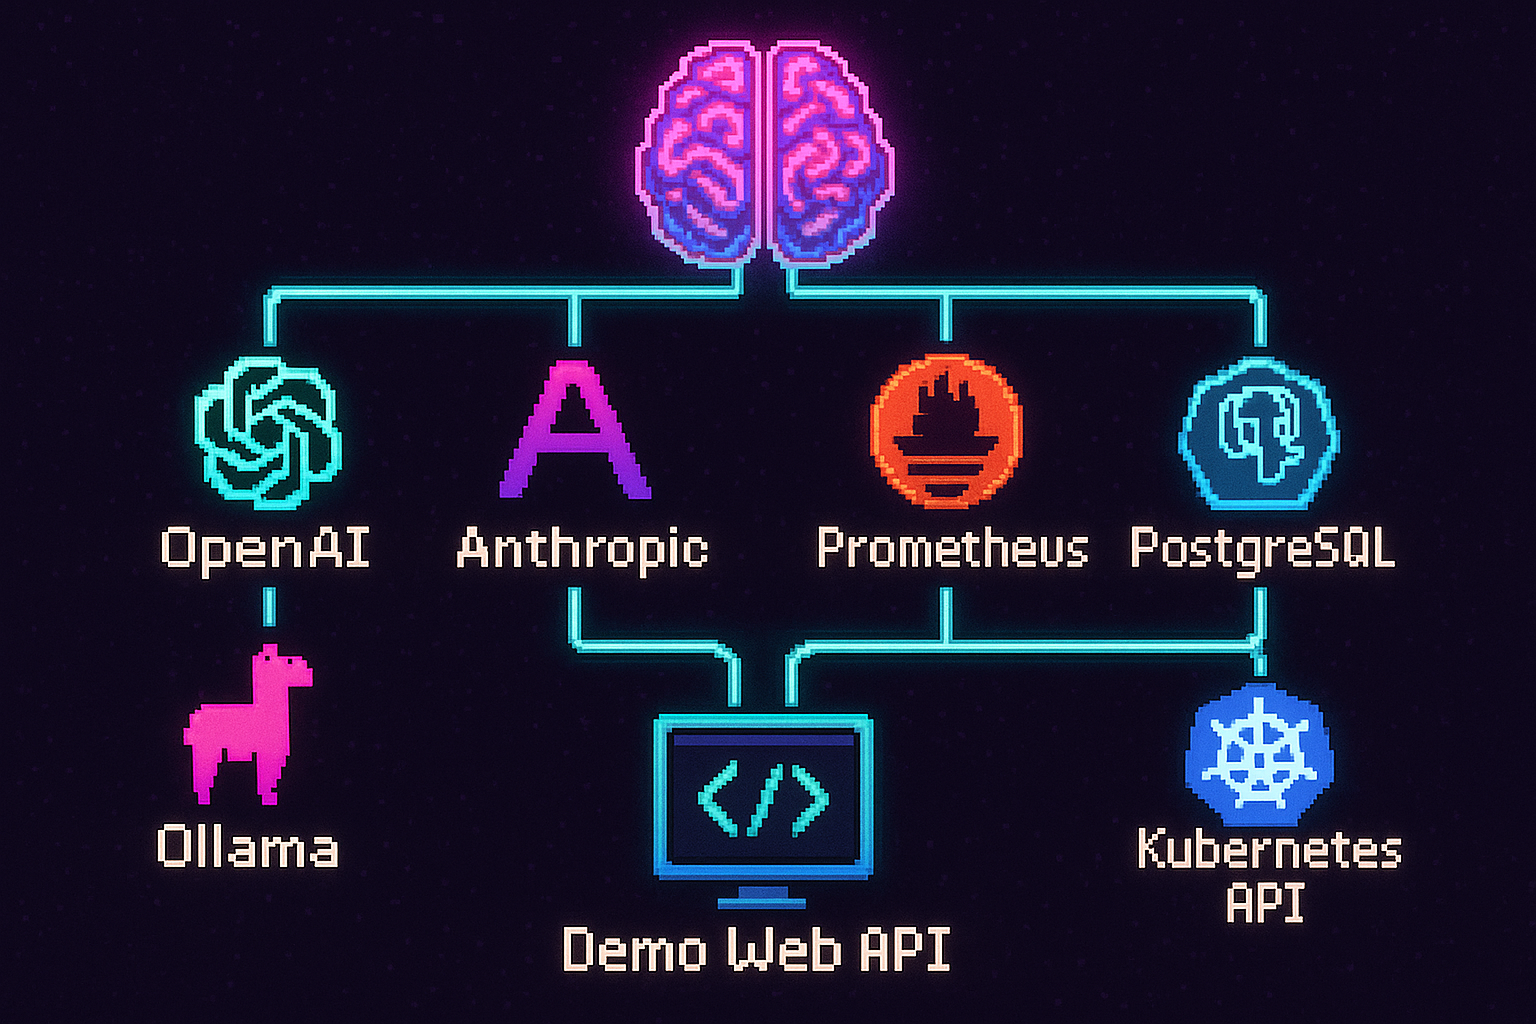
The lab stacked a few simple pieces together:
- Reasoning layer: OpenAI, Anthropic, or Ollama through a provider factory
- Operations agent: the orchestrator that decides which tools to call
- Tool layer: Prometheus, PostgreSQL, and the Kubernetes API
- Target workload: a demo web API running inside the cluster
A simplified provider factory kept the model swappable without touching execution controls:
def create_provider(settings):
    if settings.llm_provider == "openai":
        return OpenAIProvider(settings)

    if settings.llm_provider == "anthropic":
        return AnthropicProvider(settings)

    if settings.llm_provider == "ollama":
        return OllamaProvider(settings)

    raise ValueError("Unsupported LLM provider")
That separation is the point: the reasoning model can change without changing Kubernetes permissions or safety controls. The LLM handles diagnosis and planning; deterministic code controls execution.
Injecting an Application-Level Failure
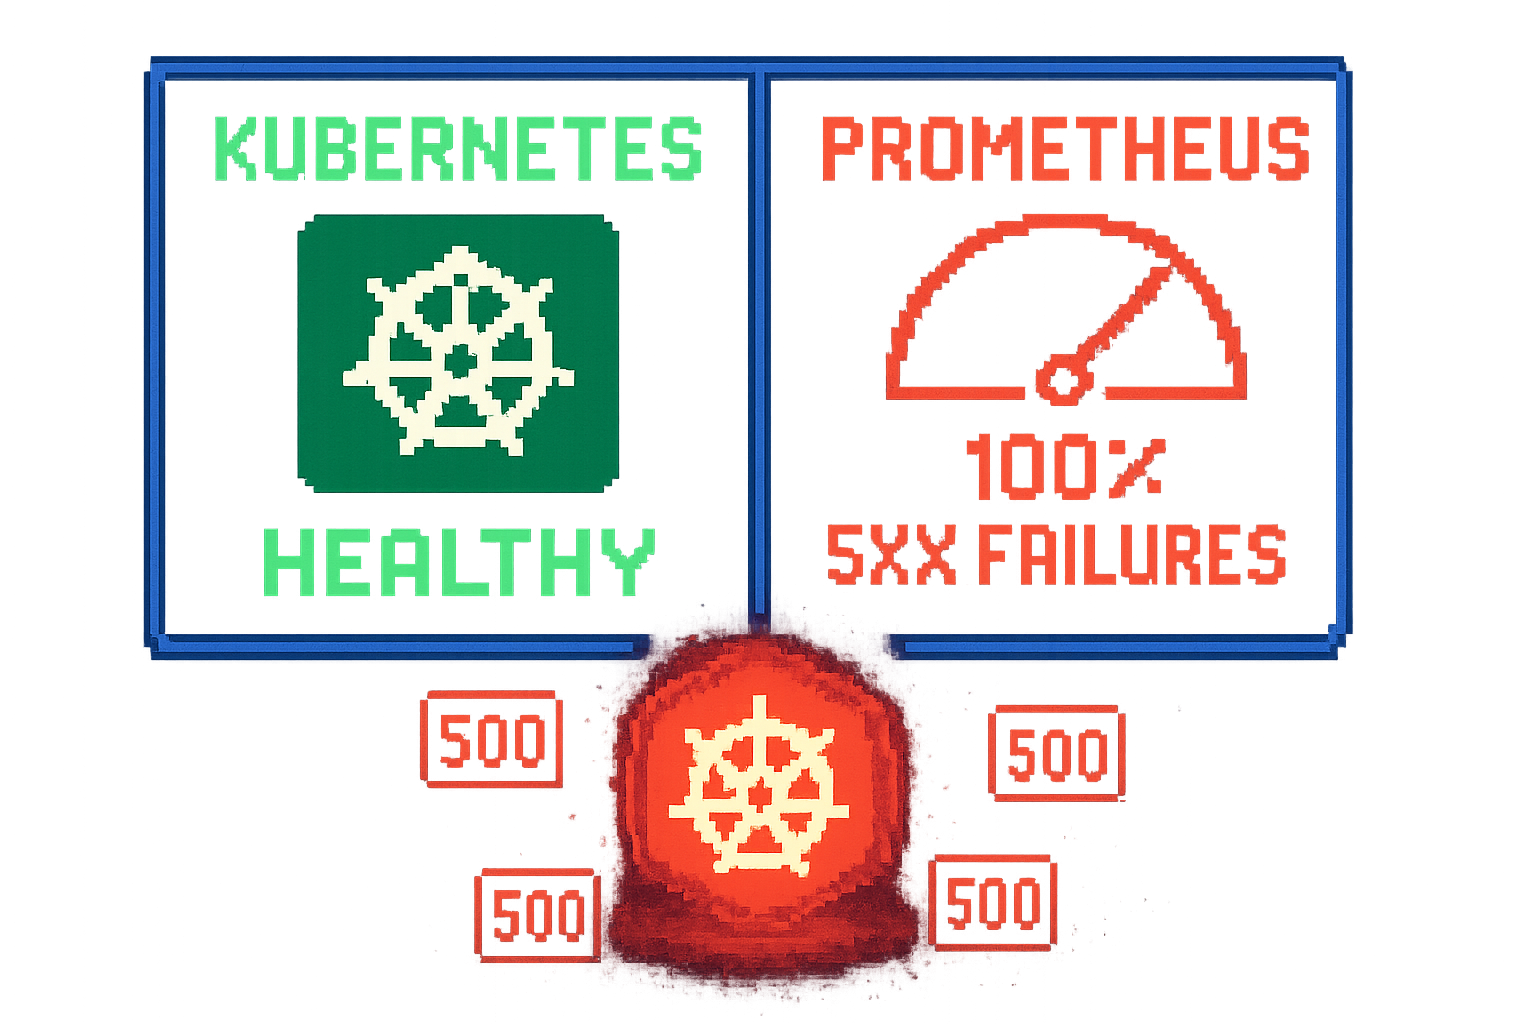
I deliberately created a failure that Kubernetes readiness would not catch.
After enabling the fault:
curl -X POST http://127.0.0.1:18080/fault/enablethe application returned:
HTTP/1.1 500 Internal Server Errorwhile Kubernetes still reported:
Pod: Running
Ready: True
Restart count: 0
The application exposed web_api_http_requests_total, and the 5xx ratio reached almost 1.0 — essentially 100% failures.
That created the failure scenario I wanted:
- Kubernetes: healthy
- Application traffic: failing
The gap between cluster health and application health is where automation would silently do nothing, or worse, declare the incident already over.
Letting the Agent Investigate
The agent gathered both telemetry and Kubernetes state through a simple observation loop:
for tool_name, params in [
    ("prometheus_query", {"query": ERROR_RATIO}),
    ("k8s_deployment_status", context),
    ("k8s_list_pods", context),
]:
    result = await tools.execute(tool_name, params, dry_run=False)
The LLM concluded that the failure was application-level rather than a scheduling or container-crash problem. It proposed a bounded action:
rollout restart
namespace: demo
deployment: web-api
But the write action was marked with risk_level: medium and requires_approval: true. With manual approval enabled, execution stopped at:
{
  "status": "approval_required"
}
That distinction matters:
The LLM can recommend an action, but policy decides whether the action is allowed.
The First Recovery Logic Was Not Good Enough
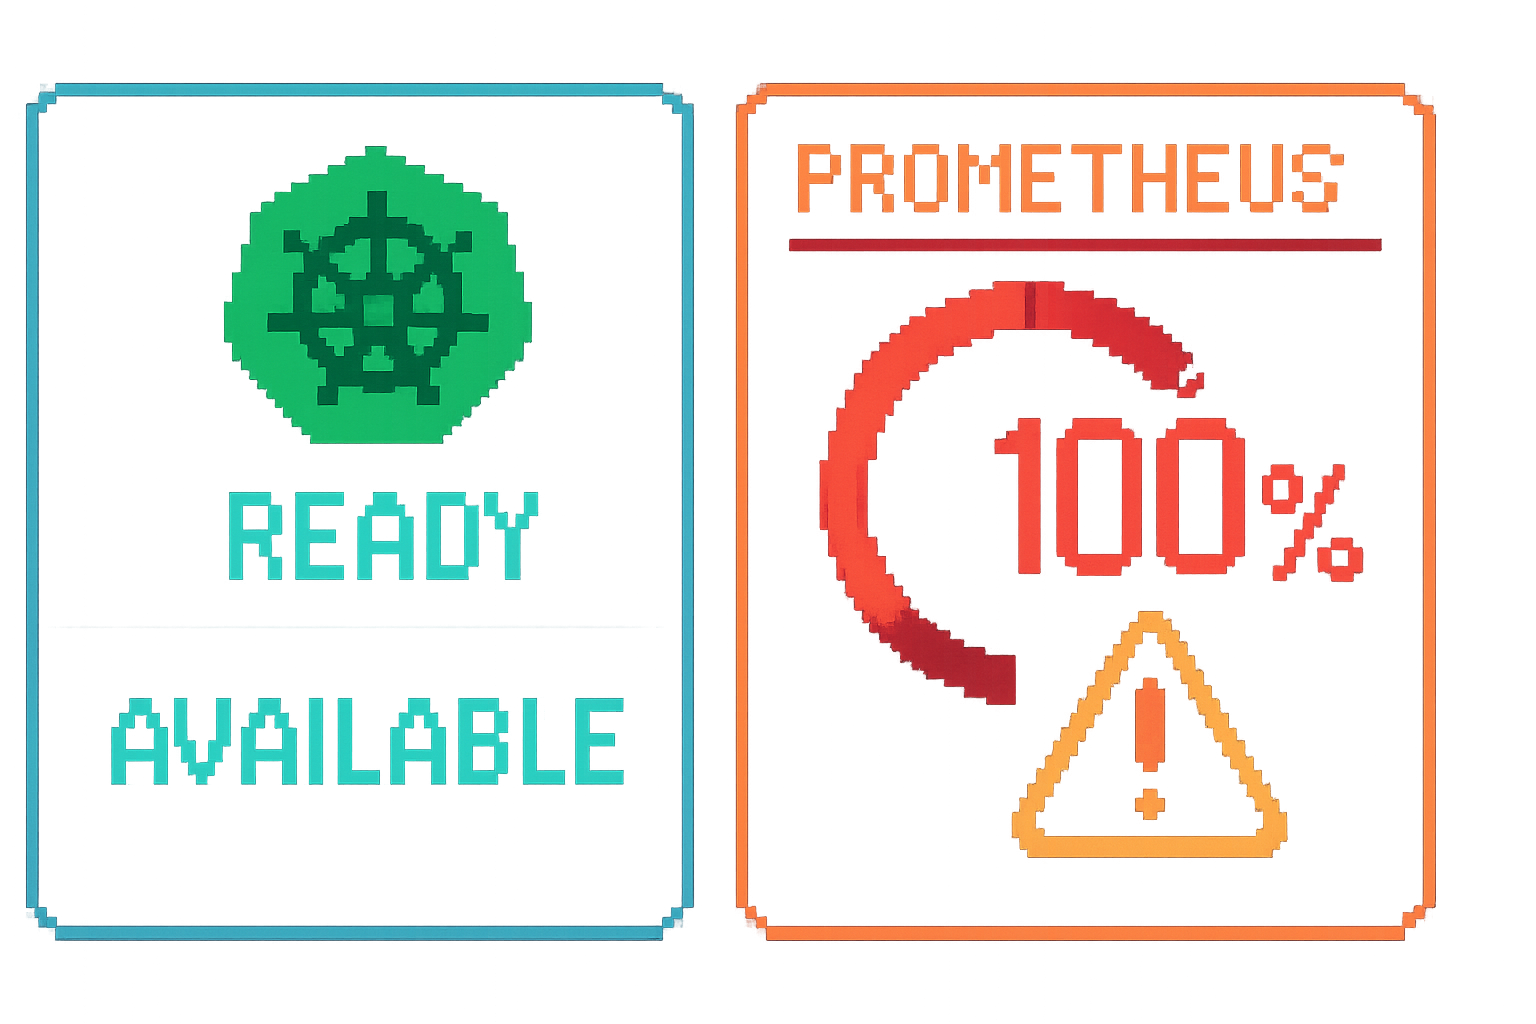
My first implementation considered this sufficient:
ready_replicas = 1
available_replicas = 1
The problem was that Prometheus still showed a 5xx ratio of 1.0. Kubernetes said the workload was available while users were still receiving errors. That exposed a flaw in the recovery contract.
I changed the logic so a restart is not considered successful until application telemetry also recovers. The final recovery settings were:
RECOVERY_5XX_THRESHOLD = 0.05
RECOVERY_REQUIRED_CONSECUTIVE_CHECKS = 3
RECOVERY_CHECK_INTERVAL_SECONDS = 10
RECOVERY_MAX_CHECKS = 12
The verification loop looked like this:
healthy = five_xx_ratio < RECOVERY_5XX_THRESHOLD

if healthy:
    consecutive += 1
else:
    consecutive = 0

if consecutive >= RECOVERY_REQUIRED_CONSECUTIVE_CHECKS:
    return {"status": "completed"}
I also normalized an empty Prometheus 5xx vector to zero:
if not result:
    normalized_value = 0.0
Once the new process stopped generating 500s, Prometheus could return no matching 5xx series. Treating that absence as zero kept the check from hanging forever.
Final Test
The agent restarted the failing workload and replaced:
OLD:
web-api-5d8fc88b7d-p8mfb
with:
NEW:
web-api-59d546895b-bcs75
Running
Ready
But it still did not immediately declare recovery. The actual verification sequence was:
100.0%  ❌
86.8%   ❌
69.8%   ❌
53.2%   ❌
36.5%   ❌
19.5%   ❌
0.0%    ✅ 1/3
0.0%    ✅ 2/3
0.0%    ✅ 3/3
Only after three consecutive checks below the 5% threshold did the agent return:
{
  "status": "completed"
}
The Prometheus graph showed the same pattern: failure ratio rising toward 100%, followed by a gradual decline after remediation. The agent waited for the application to be serving traffic, not just the cluster scheduler.
Main Takeaway
The most important part of this project was not connecting an LLM to Kubernetes. It was defining the boundary between probabilistic reasoning and deterministic control.
My final model is:
LLM
→ interpret telemetry
→ diagnose
→ propose a plan

Policy + RBAC
→ authorize the plan

Deterministic tools
→ execute the plan

Prometheus + Kubernetes
→ independently verify the result
That is the difference, in my view, between an AI infrastructure demo and a production-oriented operations agent.
A production operations agent does not just restart pods. Unless and until the replacement pod is Running, Ready, and the application is healthy, the agent said:
Not recovered yet.
It kept checking telemetry until the 500 error rate dropped to zero and the application was healthy.